The Challenge
Red River College (RRC) first became a 6P client in late 2019 after hiring us for some creative work. As often happens, the work was appreciated, and we started talking with the college about other marketing challenges it was facing. Like many businesses, regardless of sector, college leaders weren’t sure how to maximize the value of online data collected from its website. With multiple audiences to address (donors, current and potential students, faculty, executives, etc.), RRC was looking for a way to optimize each website visitor’s journey by tracking all relevant metrics and delivering a better experience. While the college’s overall goals were direct and high level—increased registrations and greater brand awareness—individual departments with more focused targets wanted ways to achieve their mandates by making better use of web metrics.

The 6P Solution
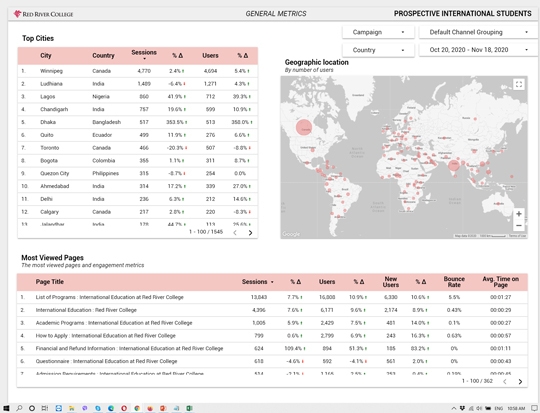
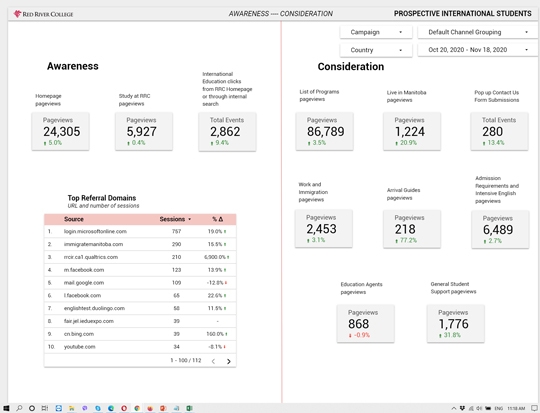
The timing couldn’t have been better for us to introduce college stakeholders to 6P’s business forward dashboard. Initially a conceptual challenge dreamed up by our president, Paul Provost, it became a minor obsession for him to find a way to help clients confidently gather and apply online intelligence. More than just a straightforward reporting tool, our dashboard includes insights, actionable recommendations, and business impact statements. It doesn’t need to leave room for data interpretation; instead, it reveals a clear story, so data interpretation is unnecessary. For its part, the college was ready to give it a try. And because each audience’s journey was unique based on their needs and applicable metrics, multiple dashboards were commissioned right from the start.
The Outcome
With each dashboard’s ability to analyze realtime live data, proof of concept was quickly established, so much so that two new dashboards are about to be added to the initial slate of four. By showing only the analytics most relevant to the specialty areas, department leaders are gaining clearer insights about how users are interacting with the college’s most popular online materials/ ideas. Dashboard reports have become an integral strategic component of the overall decisionmaking process, with multiple staff making use of these money- and time-saving online tools to get credible answers to metric-driven questions.


Connect today with a team as passionate about success as you are.