6P’s Business Forward Dashboard
Are you on track to achieve your goals? How do you know?
For CEOs and business leaders who want data-driven business intelligence that monitors and measures performance of your business – 6P’s Business Dashboard offers you a customized business intelligence tool and the expertise to create a dashboard that tells the exact story you need it to tell.
6P’s Business Forward Dashboard: Data-based insights, smarter decisions
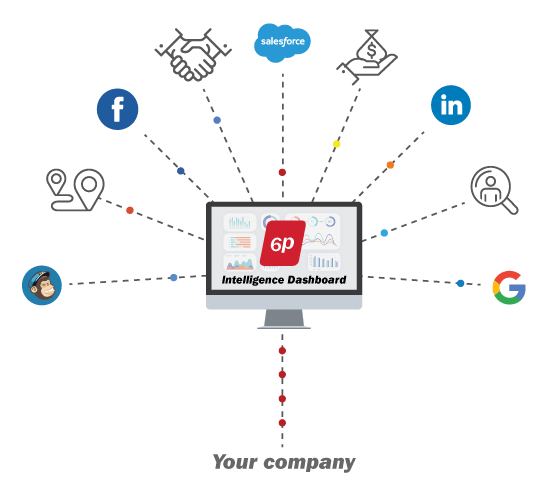
Our dashboard connects the dots between your various sources of data, utilized to generate actionable business insights, better investments, and simplify the decision-making process. It provides you with the context you need to create an actionable plan.


Data with context that answers your business questions
Our fully customized dashboard presents information that connects tactical KPIs with business impact (i.e. dollars & revenue). It ensures that your KPIs drive action, allowing you to access data that answers your key questions:
- What is my customer base and revenue in comparison to this time last year?
- Are we reaching the operations and sales goals of this quarter?
- What are we getting for our marketing spend this month?
- What actions should my teams take?
Contact us for further information on how our
dashboard can benefit your business
Optimize your organization’s performance
Simply having data will not provide you with the context or definition to create an actionable plan. With our dashboard tool, your organization also gains access to 6P’s business experts:
- 75-year combined experience in a variety of industries
- Professionals that work with dozens of clients every day, and face real business challenges
- Master’s degrees, MBAs, and professional certifications
- International work experience
“The marketing analytics online reporting tool that 6P built and configured for our organization has become our go-to tool for clear decision-making when it comes to marketing.”
– Jeremy Wilton
Marketing & Communications Specialist, G3
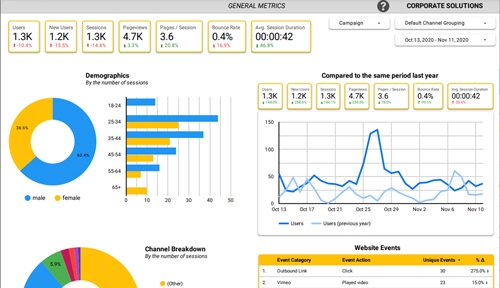
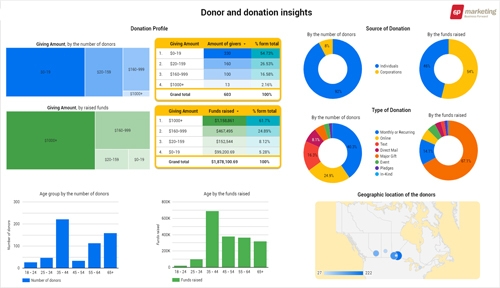
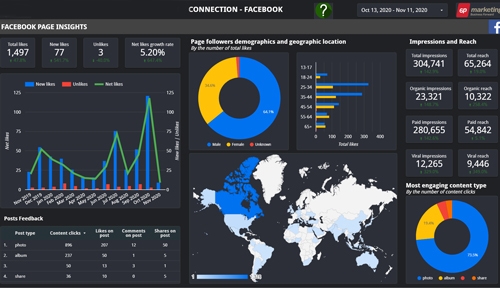
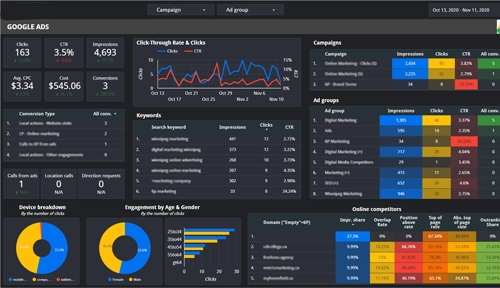
Visual, informative and straightforward reports as unique as your organization. Capture facts in areas such as:
- Your goals
- Your existing/missing key performance indicators (KPIs)
- Market and sales segmentation
- Financial performance and revenue
Upon analyzing your dashboard, our team can help your organization:
- Provide high-level strategic insights beyond the tactical KPIs
- Go beyond tactical reports
- Set customized goals and metrics (KPIs) when required
- Answer questions, tell your story – so you can make decisions based on data
- Identify opportunities
- Convert data into action by offering customized, high-level insights and dashboard optimization recommendations
Our 3-step onboarding process
1
Audit and set up
- 6P strategist meets with you to understand your:
- Business goals
- Existing/missing KPIs
- Most critical metrics
- Identification and gathering of raw data sources
- Definition of data visualization preferences
- Determine timeline and responsibilities
.
.
.
.
2
Build
- 6P to create the dashboard
- Revision of dashboards with the client
- Edits if required
.
.
.
.
3
Measure,
assess,
optimize,
take action
- 6P to provide high-level, data-based insights as well as recommendations on dashboard optimization. We’ll:
- Select the right data visualizations for the best performance
- Ensure the data in use tells the right story
- Present the most important information with the utmost simplicity
1
Audit and set up
- 6P strategist meets with you to understand your:
- Business goals
- Existing/missing KPIs
- Most critical metrics
- Identification and gathering of raw data sources
- Definition of data visualization preferences
- Determine timeline and responsibilities
.
.
.
.
2
Build
- 6P to create the dashboard
- Revision of dashboards with the client
- Edits if required
.
.
.
.
3
Measure, assess, optimize, take action
- 6P to provide high-level, data-based insights as well as recommendations on dashboard optimization. We’ll:
- Select the right data visualizations for the best performance
- Ensure the data in use tells the right story
- Present the most important information with the utmost simplicity